Operational risks measurement
Several years ago all risks not complying with the definition of market or credit risks were included amongst operational risks. This vague and strictly speaking, negative definition was completely unable to correct and efficiently manage the operational risks. The ground of a risk measurement is to understand the risks’ nature, potential sources and possible consequences, and this is something that cannot be done without clear and precise definition.
BASEL II (International Convergence of Capital Measurement and Capital Standards) defines operational risk as “a risk of loss resulting from inadequate or failed internal processes, people and systems or from external events”. This risk management standard is intended for banks and other financial institutions, where the term “operational” risk is well known and already settled.
In other (non-banking) organizations operational risk is often linked to information systems and thus by “operational risk” is usually understood as a risk primarily related to system operation. Its measurement is therefore closely related to assessing risks of the information systems and with the quality and level of information systems security.
To understand the issue of operational risk measurement, the above given definitions and terms are of great help, however, as it is the case of other similar definitions, they leave too much space for discussion on the topic of “what risk measurement is really about”. Any of these discussions should be, rather than on the precise definition, aimed towards the fundamental goals and objectives of measurement. What should measurement bring to an organization and how can measurement contribute to the increase of security, these are the essential questions to be asked, answers to them will eventually lead to the definition of “risk measurement” relevant to the specific environment of the firm or organization. To understand the essence of risks, measurement should quantify relevant data regardless of the definition of “risk measurement” we use, or whether we call these risks operational or something else. Operational risk measurement can therefore be divided into two fundamental processes:
- Measuring operational risk value;
- Measuring the level of operational risk treatment.
The objective of both measurements is to quantify a predetermined value, which represents the risk level, the extent of risk reduction or the number (or percentage) of accepted risk. In an ideal risk management environment the benefits of operational risk measurement should also be included in the process. The possibility to quantify the effectiveness of implemented security controls and/or the increase of security level should be in the portfolio of all risk managers. However measuring the benefits of operational risk treatment is not an easy task, furthermore current tools and methods used are restricted to simple Excel tables.
Case Study
According to the internal control Act No. 12/2004 every Slovakian bank shall perform periodic reviews of operational risks related to information technologies. It is an analogy of the Czech national bank internal control Act No. 2 of February 3, 2004, on the internal control system of a bank, as amended by subsequent provisions, and partly of the Regulation N. 123/2007 of the Act No. 256/2004 which is practically an implementation of BASEL II.
While risk analysis comprised an important part of the project, the main objective was to establish and implement a process of operational risk measurement in the Slovak bank. The risk management process had to be in compliance with the Act No. 12/2004 mentioned above. The executed risk analysis was the first step that helped to estimate the current risk levels. The process also included adaptation of a proven methodology and establishment of repeatable steps to manage operational risks. Implementation of comprehensible and transparent metrics to measure operational risk values and the level of their treatment was a self-evident part of the job.
There were several important parameters, mainly based on experiences collected by American experts [6], these metrics had to accomplish. Each metric used had to be:
- Measured in a consistent way, without any subjective criteria – even if more than one person uses the metrics identical results will be obtained;
- Easily fulfilled, optimally in an automatic way;
- Expressed in cardinal numbers or percentages, and not in the qualitative scale “low”, “medium”, “high”;
- Expressed in the same unit, e.g. hours, incidents, financial losses.
Global metrics to measure the level of risks and the level of risk treatment were prepared in the first phase. Subsequently other, more detailed metrics focused on specific operational risks and vulnerabilities (e.g. password strength in individual systems, security incidents) and also metrics focused on compliance with the ISO/IEC 27001 standard, were implemented. All metrics were developed in a way that enables easy and fast collection of data and is as automatic as possible.
Secondary objective for the year 2008 is to prepare an interface for the RMA and RiskBusiness KRI Framework Study methodology, used by the bank as a primary approach to risk management to reach the compliance with BASEL II requirements.
Measuring operational risk value
Value, or as it is also called measure of risk, was the first result from the performed risk analysis using qualitative methodology. Possible impacts of security violations on the bank’s activities and on reaching their business goals were estimated in the first part of the analysis. Probability that security violations would occur was estimated by assessing levels of threats and ICT vulnerabilities.
The metric used to express measure of risk was on the scale from 1 to 7, altogether 27,893 values of risk were calculated. This number, however as immense as it may seem, includes all possible combinations of identified impacts, probabilities and bank’s assets. From the operational risk perspective only 21 risks were assessed, these risks were primarily presented to management at the end of the project.
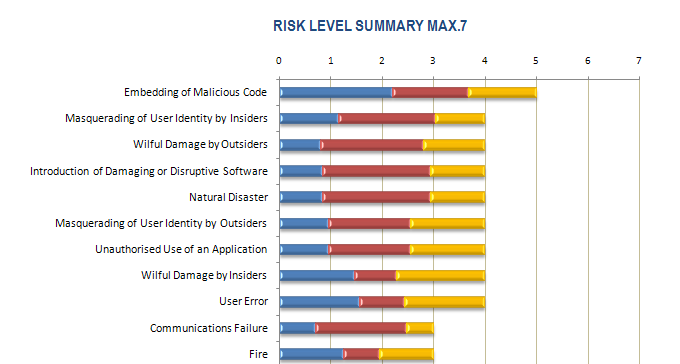
The above graph shows the risk value on the scale from 1 to 7 and its characteristics, ergo the ratio of an individual risk’s component (the first being impact and the following two are probability components –the first of the two is the level of threat and the second is the vulnerability each is expressed in different colors) and how they contribute to overall risk.
Measuring the level of operational risk treatment
Upon finishing the analysis part of all risks were evaluated against pre-established criteria and it was then decided whether they were to be accepted, treated or avoided.
For those risks that were not acceptable or couldn’t be avoided countermeasures which treat (reducing their consequence or the likelihood of the risk) specific operational risks were proposed. Existing countermeasures were considered while proposing new sets of controls. Assessing the current status of controls was an important factor later used to make decisions on the priorities of the risks and the sequence in which they would be treated. The methodology used contains an extensive list of countermeasures offering numerous recommendations on how to deal with individual risks (treatment options).
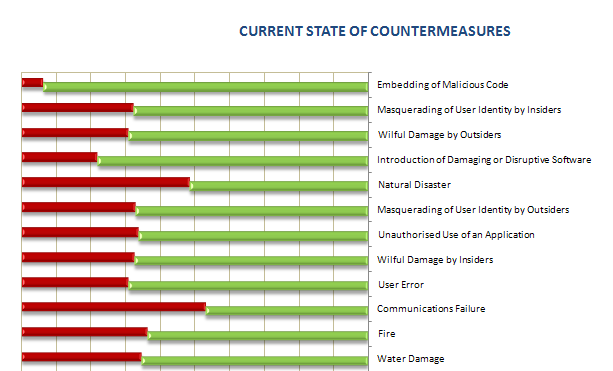
After evaluation the recommended countermeasures were divided into two sets, based on these groups metrics were developed. Countermeasures recommended to reduce the identified risks, that were found to be already in place, formed the first “green” group. Countermeasures not in place (thus need to be implemented) formed the second “red” group. By comparing the total number of countermeasures to the numbers of existing “green” and to be implanted “red” countermeasures the level of risk treatment was identified.
The relationship between risk and countermeasures was n:n, meaning that the countermeasure recommended to cover specific risk also applied to cover other risks as well. The foundation of the metric was a percentage of individual risks and thus every countermeasure was unique. Therefore although the countermeasure was calculated in the metric several times, the metric itself was not spoiled.
The results of recommended security controls evaluation is shown in the graph below (again in the form of management summary).
The big picture about the state of security in the bank is stressed by placing the graphs against each other. When presenting the results of the analysis both metrics were presented simultaneously to give uniform view both on the operational risk and at the same time on the level of its treatment.
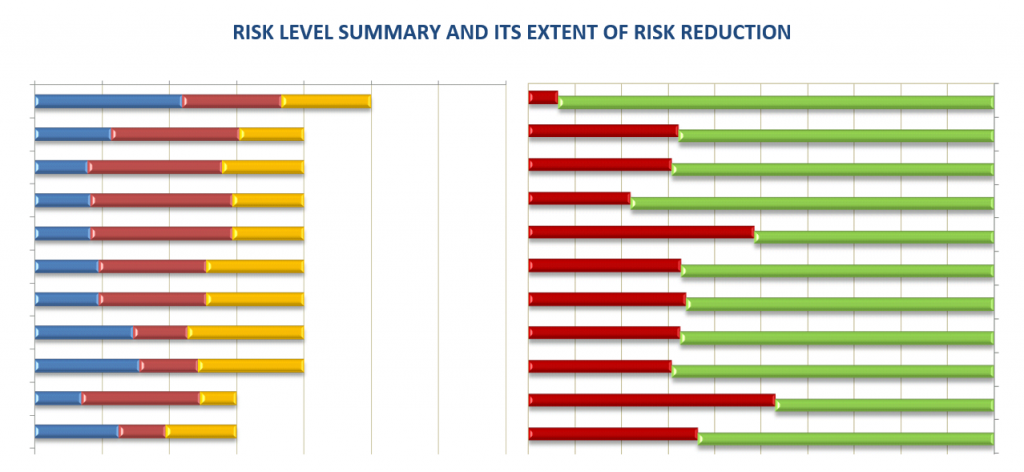
The very first risk presented in the graph above reached the measure of 5 (on the scale from 1 to 7) and is covered by 93%. This approach thus in a transparent way fulfills two basic processes of measurement – the value of operational risk and the level of its treatment. With respect to its transparency the results were presented in this simple way, no intricate situation occurred and results were easily and clearly presented to the management.
Measuring the level of operational risk treatment – detailed metrics
However the security controls were not only assessed in the way presented above, binary green-red. The risk analysis methodology used enables the reviewer to select from more statuses the recommended countermeasures are currently in.
Some of the countermeasures that were initially recommended to cover specific operational risk which were later marked as an Acceptable level of risk. It was decided that however contributive the countermeasure could be it will not be implemented for some varying reasons. In such cases the risk remained partly not treated and it was necessary to determine whether the remaining risk was not higher than the preset acceptable level of 8% (in reality the level of 4.11 % was acceptable).
Selected controls were also marked as Not Applicable where the proposed actions to raise the security level were not technologically viable or were against the core business goals of the bank. Controls that weren’t in place, but their implementation have not been finished yet (projects were in progress), were marked as Implementing recommendation.
Using other statuses of security controls more detailed metrics were prepared, these metrics presented more detailed views on the information security within the bank. The process of operational risk treatment was correctly established, however some risks exists that still needed to be treated (red column). The graph also shows the expected progress in the implementation of new controls, these were implemented during the execution of the analysis (altogether the analysis lasted 5 months).
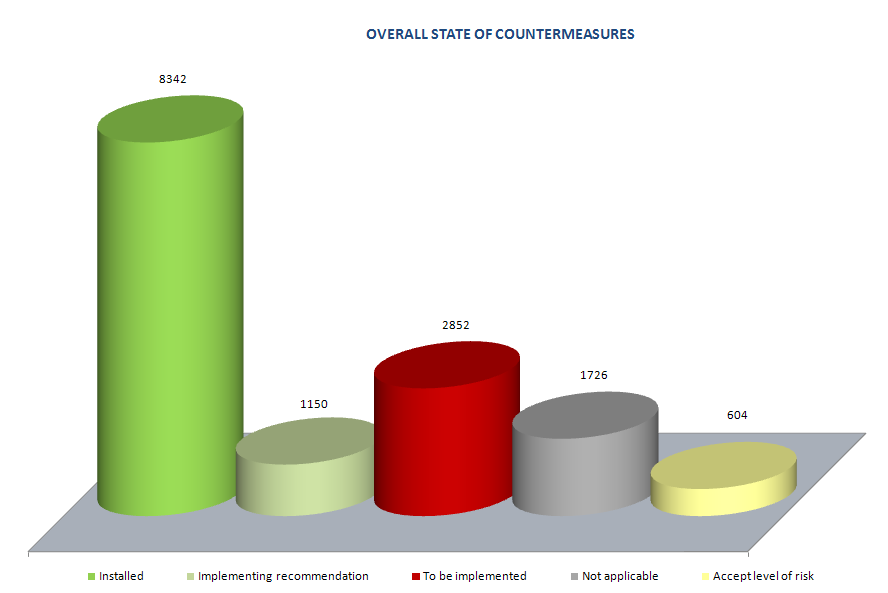
The following graph depicts individual security areas and the ratio of implemented, not applicable, recommended and other security controls.
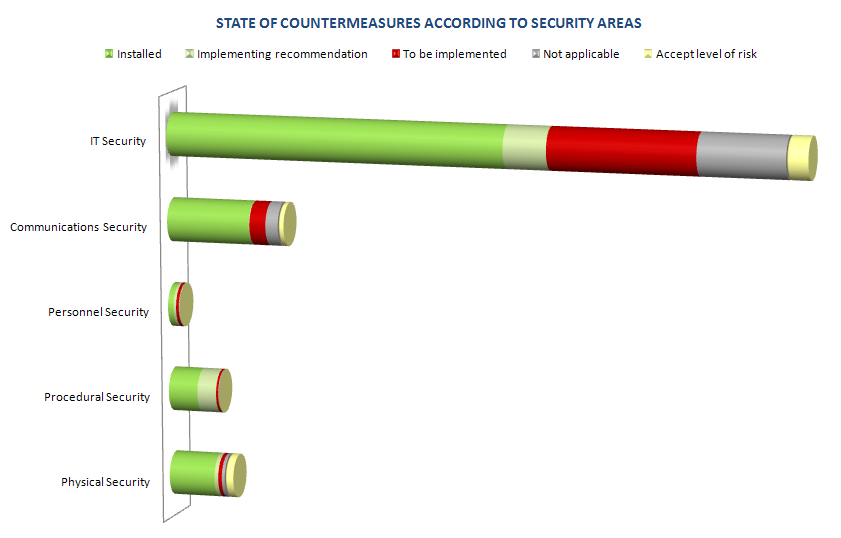
Each of the metrics described above is based on thousands of values collected, due to the level of its analytical detail these values couldn´t be presented. The objective of these simplified graphs was to show the results of the analysis and the level of operational risks treatment in an easy and comprehensive way. Based on four parameters of metrics, selected at the beginning of the project, each graph was constructed so it will be in the future easily updated with minimal effort. The procedures for the continuous data collection were developed to enable the risk treatment level to be assessed in time.
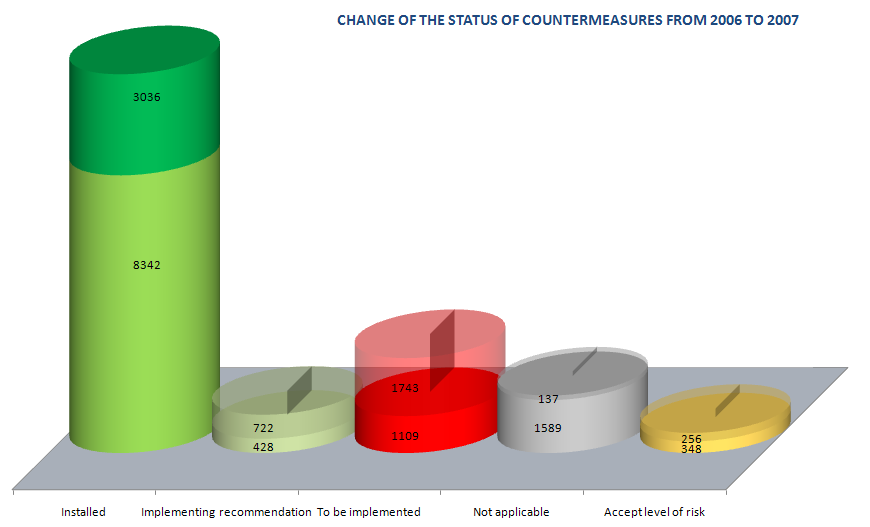
The graph displays how the number of implemented controls has increased in time, i.e. the risk treatment process was improved. Other states of countermeasures decreased and the overall number of controls also changed. The process also identified new risks as well as changes in the information system. As part of the change management process security impacts were assessed and an optimal set of countermeasures to cover newly identified operational risks were recommended.
Measuring contribution of operational risk treatment
The final implementation of recommended countermeasures is never an easy task, the best approach has shown to be the development of the set of implementation projects, to be realized by a bank’s staff. For example it is more difficult to increase the level of security of the SAS authentication system than to execute a project of “Smart Cards Implementation in the SAS system”, although in reality these are identical projects. The problem is usually in the allocation and approval of financial resources for the project. To find a sponsor for the implementation of security countermeasures is, in financially oriented institutions such as banks, almost an impossible task. On the other side to find a project sponsor is also intricate and tedious, however not an impossible task.
Individual controls or groups of recommended countermeasures were formed into implementation projects, each of these were focused on covering specific security areas. In the specific situation of the bank, 13 implementation projects were created, an example of five of these projects is listed below:
- Log Management – acquisition and implementation of a solution for continuous assessment of specific applications and system logs;
- Two-factor authentication for VPN - acquisition and implementation of two-factor authentication objects for VPN connection;
- IPS and IDS systems – increasing the effectiveness of IPS (Intrusion Prevention System) and IDS (Intrusion Detection System) for the automatic detection of security intrusion and raising alarms;
- Disaster recovery plans – preparation of disaster recovery and business continuity plans for all critical systems within the bank;
- Handling the media – establishment and implementation of procedures for manipulation with media (tapes, CDs, DVDs, flash memory cards, etc.).
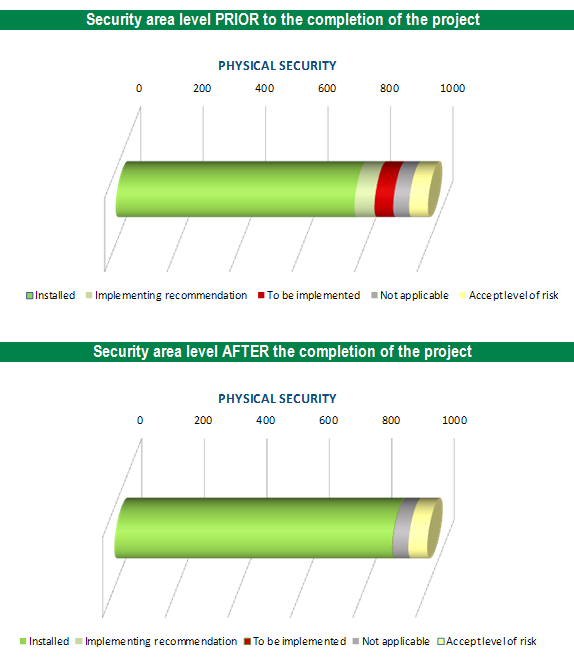
The goal was to implement a specific set of countermeasures, which in reality meant changing the status of the safeguards from “red” to “green”. To measure the contribution of countermeasures implementation was an easy task as the above described metrics work with the countermeasures statuses. For the purpose of implementation projects contribution, presentation of metrics to the bank’s management was based on security areas (IT, communication, personnel, physical and administrative). The project executed has changed statuses of countermeasures in specific security areas and in this way was a contributing factor in those specific areas. The security level of the areas was increased resulting from the fact that relevant risks were sufficiently treated. The increase of the risk treatment level was measured by the number of implemented countermeasures.
The first graph shows the status in the physical security area before the implementation of security controls, as these were implemented within one project. The second graph then displays the state after the project was finished. Countermeasures recommended for implementation (red color) has changed its status upon completion of the project to the status implemented (green color).
Based on the number of countermeasures and their current statuses it was possible to clearly predict the future levels of risk treatment after the implementation projects were completed. As the current state was know and the future state of countermeasures predictable, it was possible to determine the current and future levels of risks treatment as well as the future level of security within the bank or in specific security areas within the bank.
Conclusion
The corner stone of the operational risks measurement is to implement a consistent methodology or to use a sufficiently transparent interface in between different methodologies and tools. It is necessary to develop such metrics, which will be easily comprehensible and will enable fast and easy determination of risks levels and the levels of their treatment in time, and thus enable tracking of risk trends or perform periodic benchmarking.
Operational risks measurements, as well as other measurements of security, are a new area that will be more and more pronounced. The time has moved to an era where many of “IT driven” companies have implemented information security management systems and learned how to measure the level of risks. The contribution of security changes in risks treatment levels or security progress at this time are, so far, abilities which only a few security managers have at their disposal. One of the main reasons is ignorance of the measurement processes and little knowledge about security metrics, their preparation, usage and effective presentation. The highly anticipated new international standard, ISO/IEC 27004 - Information Security Management Measurements, should bring more light into the area of security metrics and the overall process of measurement. Meanwhile several, more or less usable, standards and publications are available, see bibliography below.
Resources & References
[1] AZ/NZS 4360:2004 Risk Management[2] ISO/IEC 27001 & 27002 Implementation Guidance and Metrics
[3] BIP 0074 Measuring of effectiveness of ISMS implementation
[4] NIST SP 800-55 Security Metrics Guide for Information Technology Systems
[5] NIST SP 800-80 Guide for Developing Performance Metrics for Information Security
[6] Andrew Jaquith, Security Metrics: Replacing Fear, Uncertainty, and Doubt, Addison-Wesley, 2007
The article was published in ISACA Jurnal Online in 2008 and presented on Information Security Summit 2008.
Download English & Czech version

